

China Telecom Announces Operation Profile of Power Industry from January to February 2019

From January to February, the growth rate of electricity consumption in the whole society slowed down year on year, and the electricity consumption of tertiary industry and urban and rural residents increased rapidly. The growth rate of accumulated power consumption in industry and manufacturing industry nationwide has narrowed. The cumulative power consumption of the four high-load energy industries has all increased positively. The growth rate of installed power generation capacity continued to slow, while that of hydropower and nuclear power increased year on year. The utilization hours of thermal power generating equipment were basically the same as that of the previous year, while the utilization hours of hydropower generating equipment increased year on year. The total amount of electricity delivered across regions and provinces in the country has increased rapidly. New installed capacity of national infrastructure decreased year-on-year, among which solar power generation and thermal power generation decreased more. Investment in power supply and power grid fell year on year.
First, the growth rate of electricity consumption in the whole society slowed down year on year, and the electricity consumption of the tertiary industry and urban and rural residents increased rapidly.
From January to February, the electricity consumption of the whole society was 1,106.3 billion kilowatt-hours, up 4.5% year-on-year, 8.8 percentage points lower than the same period last year.
By industry, from January to February, the primary industry consumed 11 billion kilowatt hours of electricity, up 7.9% year-on-year, down 4.7 percentage points from the same period last year, contributing 1.7% to the growth of electricity consumption in the whole society. The power consumption of the secondary industry was 705.9 billion kilowatt hours, up 1.2% year on year, down 10.3 percentage points from the same period last year, accounting for 63.8% of the total social power consumption and 18.2% of the total social power consumption. The electricity consumption of the tertiary industry was 1994 billion kilowatt hours, up 10.4% year-on-year, down 8.4 percentage points from the same period last year, accounting for 18.0% of the electricity consumption of the whole society and 39.9% of the increase in electricity consumption of the whole society. Urban and rural residents' domestic electricity consumption reached 189.9 billion kilowatt-hours, up 11.1% year-on-year, a drop of 4.1 percentage points from the same period last year, accounting for 17.2% of the total social electricity consumption and 40.2% of the total social electricity consumption growth.

图1 2018、2019年分月全社会用电量及其增速
According to provinces, from January to February, the electricity consumption of the whole society in all provinces of the country increased positively except Qinghai, Yunnan, Fujian, Jilin and Heilongjiang. Among them, there are 16 provinces whose electricity consumption growth rate is higher than the national average (4.5%), which are Tibet (20.2%), Inner Mongolia (13.0%), Hubei (10.6%), Anhui (10.6%), Xinjiang (10.6%), Ningxia (9.5%), Hunan (8.4%), Guangxi (8.1%), Shanxi (7.8%), Jiangxi (7.2%), Shaanxi (6.5%), Hebei (6.5%), Henan (6.4%), Hainan (5.7%), Guizhou (5.2%) and Sichuan (5.0%).
Second, the national industry, manufacturing industry cumulative electricity consumption growth narrowed
From January to February, the national industrial electricity consumption reached 690.8 billion kilowatt-hours, up 1.0% year-on-year, down 10.2 percentage points from the same period last year, accounting for 62.4% of the total social electricity consumption and 14.5% of the total social electricity consumption.
From January to February, the electricity consumption of the national manufacturing industry was 532 billion kilowatt-hours, up 0.8% year-on-year, 12.2 percentage points lower than that of the same period of the previous year, accounting for 48.1% of the electricity consumption of the whole society, and contributing 8.8% to the growth of the electricity consumption of the whole society.
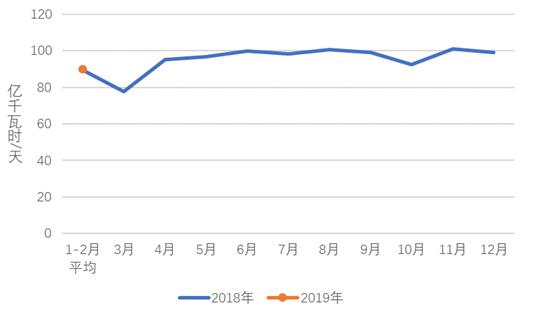
图2 2018、2019年分月制造业日均用电量
Thired,the accumulated power consumption of the three or four high-load energy industries has all increased positively.
From January to February, the electricity consumption of the four high-energy industries of chemical raw material products, non-metallic mineral products, ferrous metal smelting and non-ferrous metal smelting totaled 302.3 billion kilowatt hours, up 2.1% year on year and 6.1 percentage points lower than that of the same period last year. The total electricity consumption accounted for 27.3% of the electricity consumption of the whole society and contributed 13.4% to the growth of electricity consumption of the whole society. Among them, the electricity consumption of the chemical industry was 73.8 billion kilowatt-hours, up 2.4% year-on-year, down 2.1 percentage points from the same period last year. The building materials industry consumed 45.7 billion kilowatt hours of electricity, up 2.4% year-on-year, down 18.6 percentage points from the same period last year. Black metal smelting industry used 88 billion kilowatt hours of electricity, up 2.7% year-on-year, down 9.4 percentage points from the same period last year. The nonferrous metal smelting industry reached 95 billion kilowatt hours, up 1.3% year-on-year, down 0.8 percentage points from the same period last year.
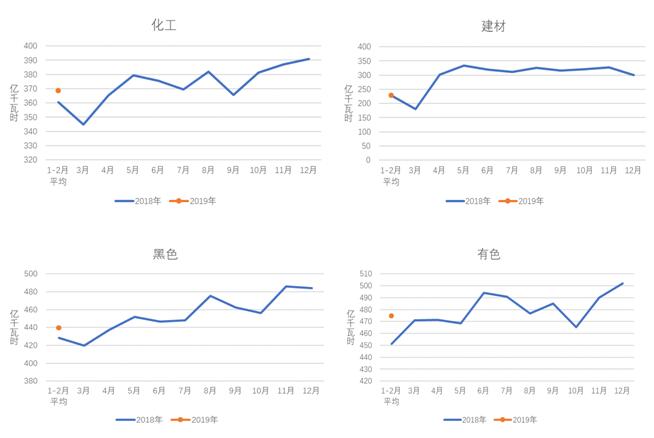
图3 2018、2019年重点行业分月用电量情况
Fourth, the growth rate of installed power generation capacity continued to slow, while the growth rate of hydropower and nuclear power generation increased year on year.
By the end of February, the installed capacity of power plants with a capacity of 6,000 kilowatts and above nationwide was 1.81 billion kilowatts, up 5.6% year-on-year, and the growth rate was 0.7 percentage points lower than that of the same period last year. Hydropower is 310 million kilowatts, of which 280 million kilowatts are conventional hydropower. Thermal power is 1.14 billion kilowatts, of which coal-fired power is 1.01 billion kilowatts and gas-fired power is 83.58 million kilowatts. Nuclear power 45.91 million kilowatts; Grid-connected wind power is 190 million kilowatts; Grid-connected solar power generation is 130 million kilowatts. From January to February, the power generation capacity of power plants above national scale reached 109.82 billion kilowatt hours, up 2.9% year-on-year, and the growth rate dropped 8.1 percentage points from the same period last year.
From January to February, the hydropower generation capacity of power plants above national scale reached 135.2 billion kilowatt hours, up 6.6% year-on-year, an increase of 0.7 percentage points over the same period last year. Sichuan (36.9 billion kWh), Yunnan (30.5 billion kWh) and Hubei (15.2 billion kWh) are the top three provinces in China's hydropower generation, accounting for 61.1% of the country's hydropower generation, with year-on-year increases of -1.3%, 17.2% and -6.4% respectively.
From January to February, the power generation capacity of thermal power plants above the national scale reached 842.7 billion kilowatt hours, up 1.7% year on year and 8.1 percentage points lower than the same period last year. In terms of provinces, there are a total of 18 provinces in the country whose thermal power generation increased year on year. Among them, Tibet (19.2%), Sichuan (17.6%), Hubei (15.9%), Beijing (13.9%), Ningxia (10.8%), Hebei (10.7%) and Inner Mongolia (10.7%) are the provinces where the growth rate exceeds 10%. The thermal power generation of the other 13 provinces decreased year on year, of which Yunnan, Guangdong and Hainan decreased by more than 10%, respectively -20.7%, -18.9% and -11.8%.
From January to February, the nation's nuclear power generation capacity reached 48.4 billion kilowatt hours, up 23.0% year-on-year, an increase of 5.1 percentage points over the same period last year.
From January to February, 65.3 billion kilowatt-hours of electricity were generated by wind power plants with a capacity of 6,000 kilowatts or more nationwide, up 2.4% year-on-year, down 37.7 percentage points from the same period last year.
Five, the utilization hours of thermal power generation equipment were basically the same as the previous year, and the utilization hours of hydropower generation equipment increased year on year.
From January to February, the cumulative average utilization hours of power generation equipment nationwide were 611 hours, down 3 hours from the same period last year.
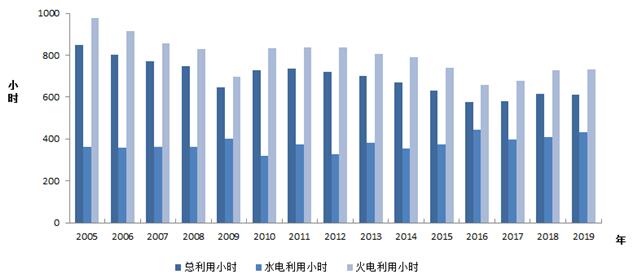
图4 2005年以来历年1-2月份利用小时情况
By type, from January to February, the national average utilization hour of hydropower equipment was 433 hours, an increase of 23 hours over the same period last year. Of the eight provinces with installed hydropower capacity of more than 10 million kilowatts, Hunan, Guizhou, Qinghai, Yunnan, Guangdong and Guangxi increased 212, 64, 56, 52, 29 and 20 hours, respectively, while Sichuan and Hubei decreased 33 and 30 hours, respectively, year on year. The national average utilization hour of thermal power equipment was 730 hours (of which, the average utilization hours of coal-fired power generation and gas-fired power generation equipment were 757 and 397 hours respectively), an increase of 1 hour over the same period last year. In terms of provinces, the utilization hours of thermal power equipment in 14 provinces across the country exceed the national average, with Gansu exceeding 900 hours, Hubei, Qinghai, Hebei, Anhui, Shaanxi, Xinjiang, inner Mongolia, Jiangxi and Beijing exceeding 800 hours, while Yunnan and Tibet only have 205 and 55 hours. Compared with the same period last year, the utilization hours of thermal power in 15 provinces increased year on year, including 155 hours in Sichuan, more than 100 hours in Xinjiang, Gansu, Hubei and Beijing, and 112 and 100 hours in Guangdong and Hainan. The average utilization hours of nuclear power equipment nationwide are 1040 hours, down 53 hours from the same period last year. The national average utilization time of grid-connected wind power equipment was 351 hours, 36 hours lower than that of the same period last year. The national average utilization of solar power generation equipment is 164 hours.
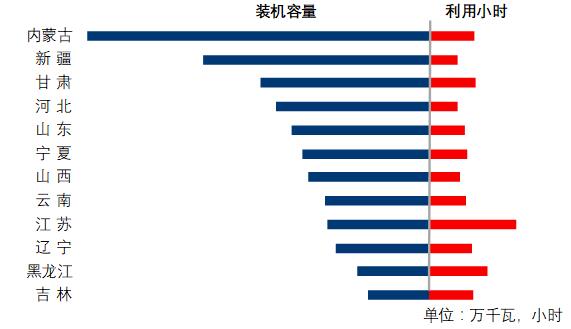
图5 1-2月份风电装机较多省份风电装机容量和设备利用小时
Six, the national trans-regional and trans-provincial total power output increased rapidly
From January to February, 68.8 billion kilowatt-hours of electricity transmission were completed across the country, up 11.8% year-on-year. Among them, North China sent 1.2 billion kilowatt-hours to Central China (UHV), up 29.6% year-on-year; North China sent East China 6.9 billion kilowatt hours, up 29.3% year on year. Northeast China sent 6.8 billion kilowatt-hours to North China, up 75.6% year-on-year. Central China sends 3.1 billion kilowatt-hours to East China, down 0.6% year on year. Central China sent 2.9 billion kilowatt-hours to the south, up 10.9% year on year. Northwest China sent 18.5 billion kilowatt-hours to North and Central China, up 1.8% year on year. Southwest China sent 10.1 billion kilowatt-hours to East China, down 1.6% year-on-year.
From January to February, all provinces in the country sent out 191.7 billion kilowatt hours of electricity, up 9.8% year-on-year. Among them, Inner Mongolia sent 28.4 billion kilowatt hours of electricity, up 7.2% year on year. Yunnan delivered 19 billion kilowatt-hours of electricity, up 40.9% year-on-year. Shanxi sent 17.2 billion kilowatt-hours of electricity, up 4.6% year-on-year. Sichuan delivered 14 billion kilowatt hours of electricity, down 2.1% year on year. Ningxia sent 12.2 billion kilowatt hours of electricity, up 15.3% year on year. Gansu sent 11.7 billion kilowatt-hours of electricity, up 26.4% year-on-year. Anhui delivered 10.4 billion kilowatt hours of electricity, up 15.8% year-on-year. Xinjiang delivered 9.4 billion kilowatt hours of electricity, up 2.2% year-on-year. Shaanxi delivered 8.8 billion kilowatt hours of electricity, up 9.3% year on year. Hubei delivered 8.6 billion kilowatt hours of electricity, down 5.3% year on year. Guizhou sent 8.3 billion kilowatt-hours of electricity, up 51.2% year-on-year. Hebei delivered 8.2 billion kilowatt-hours of electricity, down 2.9% year-on-year.
Seven, the national infrastructure new installed capacity decreased year on year, including solar power and thermal power new installed capacity decreased more
From January to February, the country's capital construction added 11.89 million kilowatts of power generation capacity, 11.79 million kilowatts less than the same period last year. Among them, 270,000 kilowatts of hydropower, 5.48 million kilowatts of thermal power, 1.25 million kilowatts of nuclear power, 1.41 million kilowatts of wind power and 3.49 million kilowatts of solar power. Hydropower, thermal power, wind power and solar power were put into production 41,52,371 and 7.39 million kilowatts less than the same period last year, while nuclear power was put into production 1.25 million kilowatts more than the same period last year.
Eight, power supply and power grid completed investment fell year-on-year
From January to February, the total investment in power supply projects completed by major power generation enterprises nationwide was 24.3 billion yuan, down 3.3% year on year. Among them, hydropower reached 11 billion yuan, up 108.9% year on year. Thermal power was 4.4 billion yuan, down 41.7% year on year. Nuclear power was 4.8 billion yuan, down 31.0% year on year. Wind power was 3.3 billion yuan, down 23.3% year on year. Investment in clean energy such as hydropower, nuclear power and wind power accounted for 81.8% of the total investment in power supply, an increase of 11.9 percentage points over the same period last year.
From January to February, the national power grid project completed an investment of 24.4 billion yuan, down 9.0% year on year.
Source: China Telecom

- E-mail: cttcable@gmail.com
- 130 Jinsong 3rd Road, Lishonglang Community, Gongming Street, Guangming District, Shenzhen
